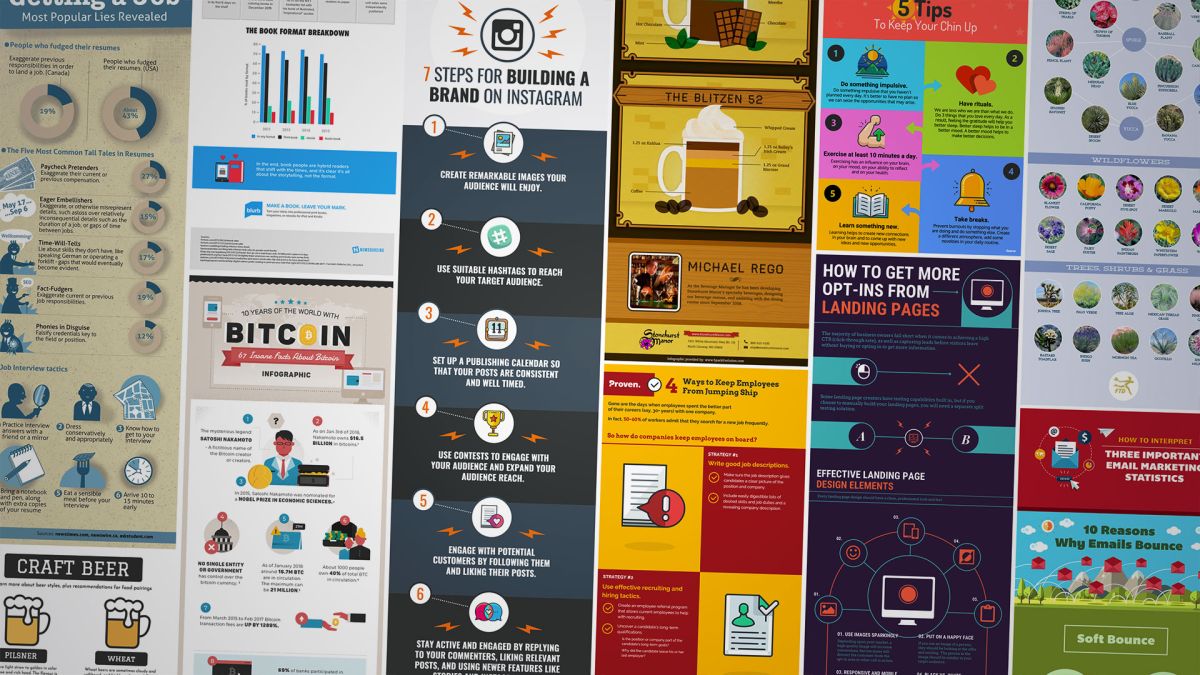
What are Infographics
Infographics are graphic visual representations of information, data, or knowledge intended to present information quickly and clearly. An effective infographic delivers data and analysis in a way that helps your audience digest and understand information easily in a visually pleasing format.
Types Of Infographics
Timeline Infographic
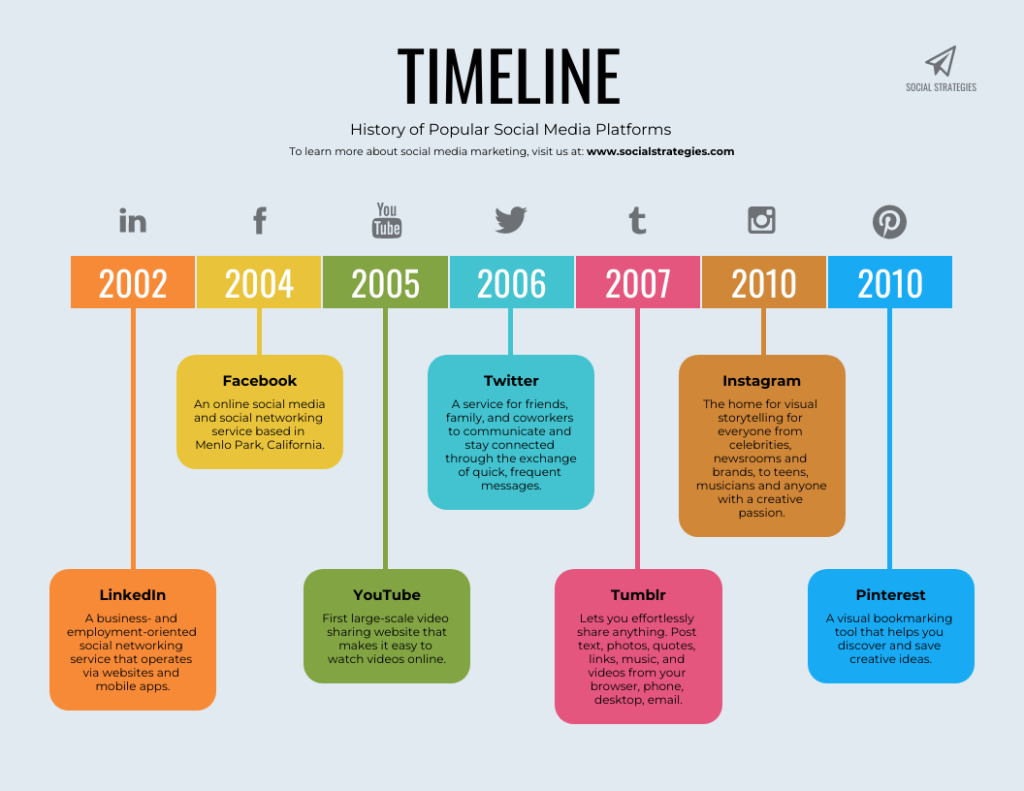
Timeline infographics are the best type of infographic for visualizing the history of something, highlighting important dates, or giving an overview of events (for example, a project timeline).
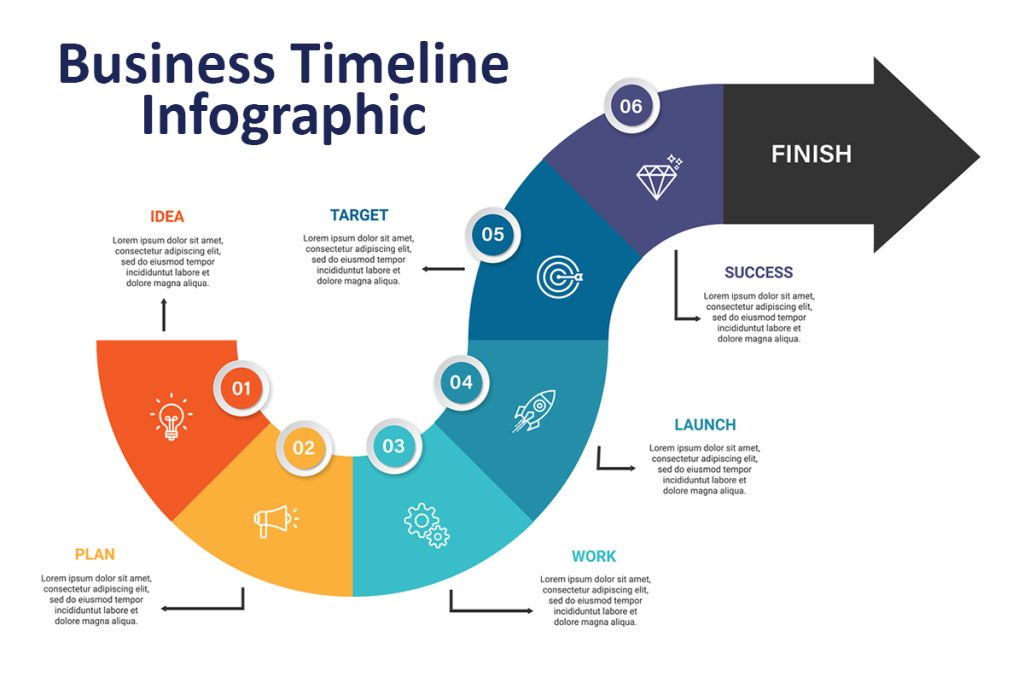
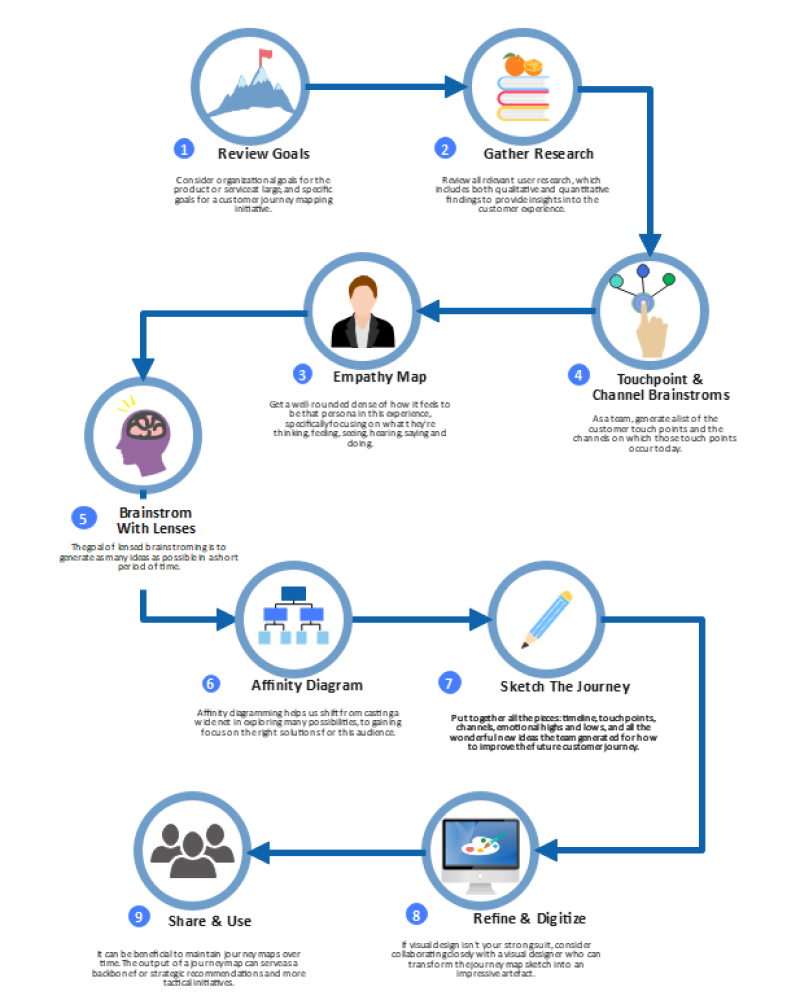
Process Infographic
Process infographics are a specific type of infographic, designed to visualize, summarize and simplify processes. They’re perfect for visualizing marketing strategies, new employee onboarding, customer journey maps, product guides, recipes and more
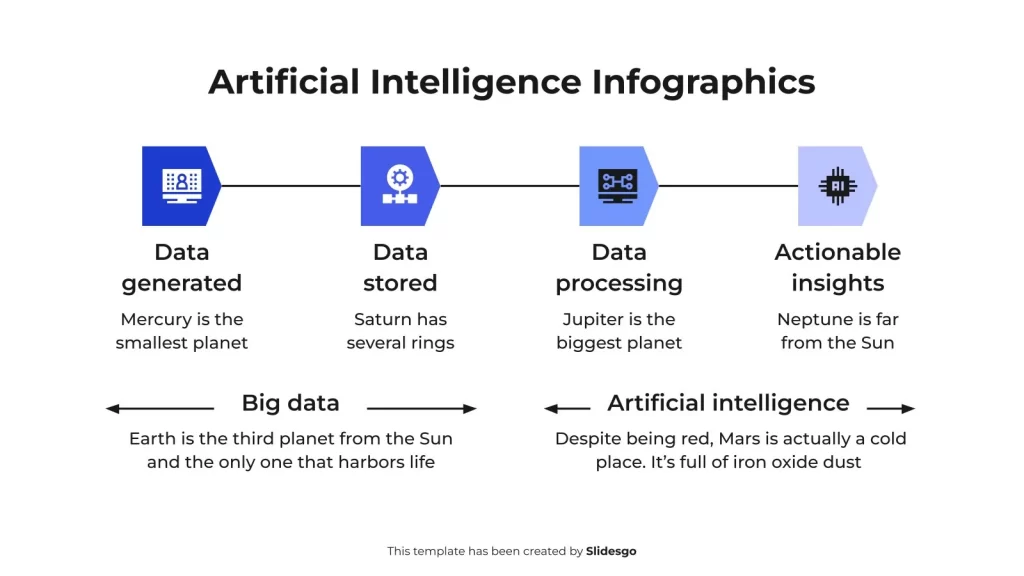
Informational Infographic

The informational infographic format is perfect if you want to: Share an overview of a specific topic. Introduce a new idea or concept. Make a plain blog post or article more engaging for your readers
Map Infographic
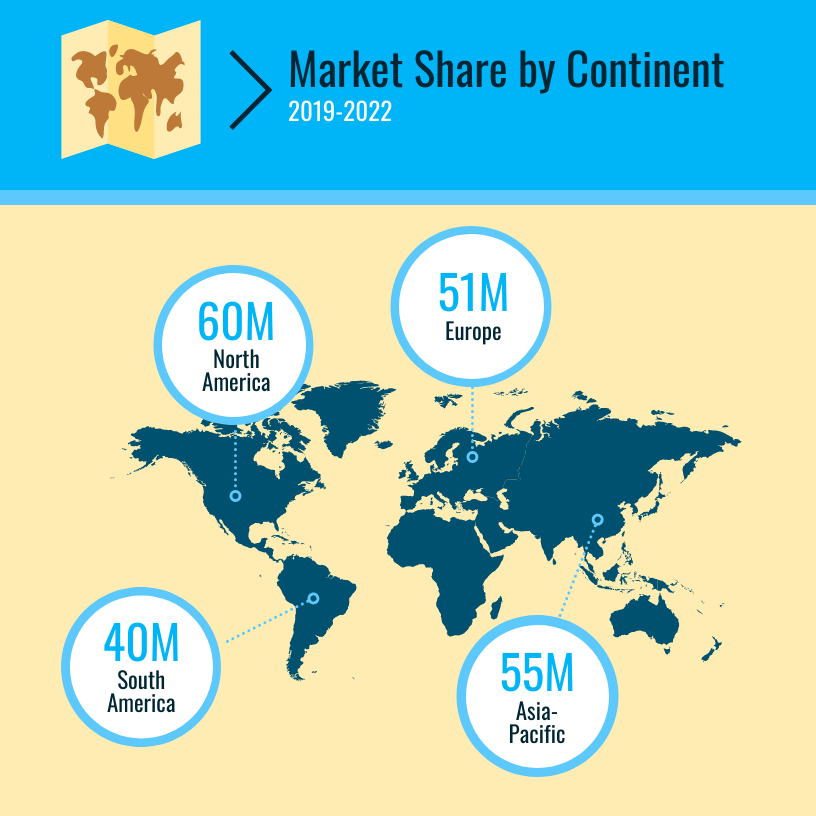
A map infographic is a visual representation of location-based information. Some of the most common types of map infographics include information like: Geographic data
Resume Infographic
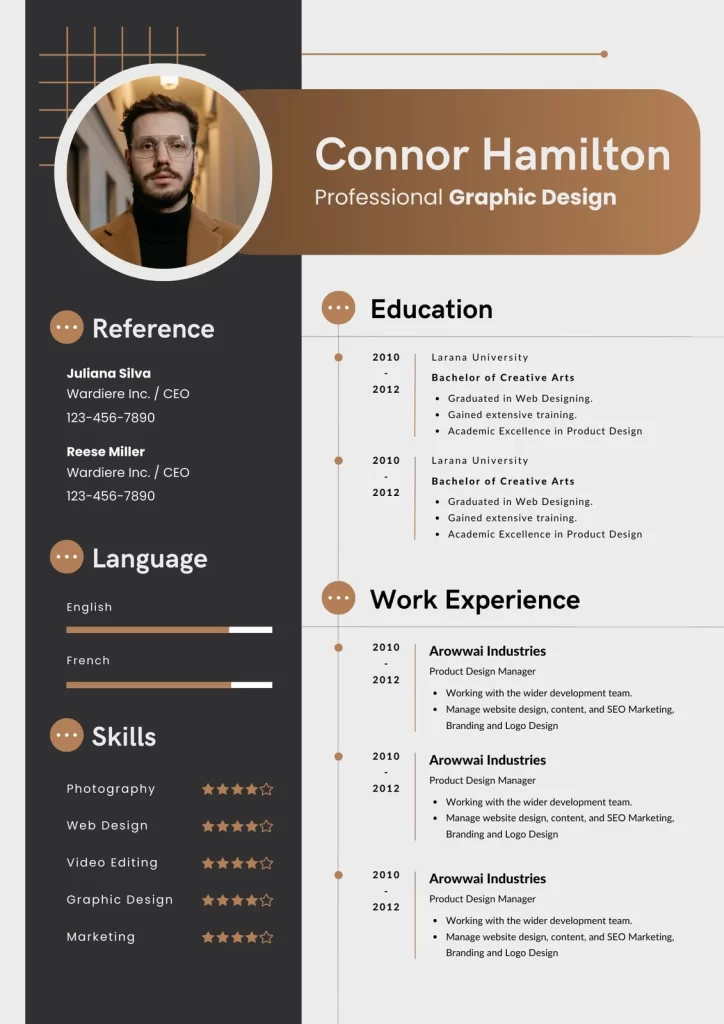
An infographic resume is a visual representation of your job experience, skills, and qualifications. Instead of being text-based like a traditional resume, an infographic resume uses graphic design elements such as icons, graphs, and timelines to present your information.
List Infographic
A list infographic is an informational graphic that uses a written list to get a message across. It’s full of written copy, but it’s also highly visual. Like other kinds of graphics, it’s eye-catching and typically includes a wide range of design elements.
Comparison Infographic
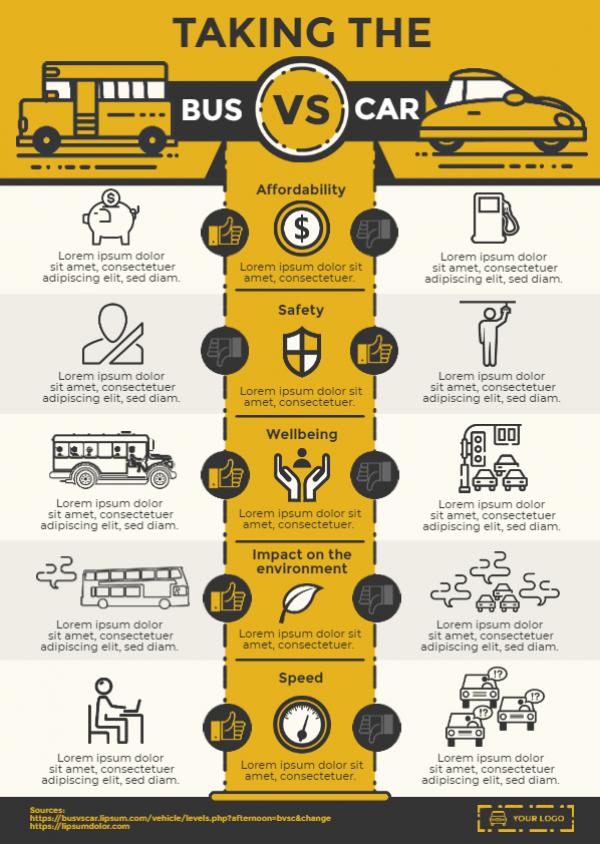
A comparison infographic is a visual representation using images and text to compare two or more items. These items depend on the topic of your infographic.
Flowchart Infographic
A flowchart infographic is a graphical representation of an information stream, such as a sequence of different steps or actions.
Tools for creating Infographics.
1. Snappa
Create eye-catchy infographics with Snappa from hundreds of customizable templates.

Watch tutorial below on how to design Infographics using Snappa
2. Piktochart
Design appealing Infographics with Piktochart choosing from a wide range of templates. It has also map integration in case you want to visualize areas on a country map.

Watch tutorial below on how to design Infographics using Piktochart
3. Canva
Canva is one of the leading graphic design platforms. It offers appealing templates you can use to create nice Infographics.

Watch tutorial below of how to design Infographics using Canva
4. PosterMyWall
Similar to Canva, PosterMyWall provides a range of visually appealing Infographic templates you can pick from to design quickly.

Watch tutorial below of how to design Infographics using PosterMyWall
5. Visme
Create professional presentations, interactive infographics, beautiful design and engaging videos, all in one place.

Watch tutorial below of how to design Infographics using Visme
Tips for creating appealing Infographics
- Make it useful to your target audience
- Write a compelling title for your infographic
- Use the right infographic layout for your data
- Do your research
- Choose the right fonts
- Keep it clean and simple
- Use your branding
- Balance space out proportionately

Leave a Reply